| StockFetcher Forums · General Discussion · Dyanmic lowest/highest for X days (variable). | << 1 2 >>Post Follow-up |
| rafting101 13 posts msg #161436 - Ignore rafting101 |
11/26/2024 5:59:56 AM I want to set a variable to contain the lowest value of the last X days. If X is a constant, lets say 10, its easy: set{lowest, low 10 day low} but if X is a variable, is there a way it can be done? This does NOT work: set{x, 10} set{lowest, low x day low} is there some dynamic lowest() or highest() function that i am missing? |
| rafting101 13 posts msg #161437 - Ignore rafting101 |
11/26/2024 7:56:46 AM Explanation: The reason is that I want to be able to get the value of the "base lowest low". base is defined since the last break of highest high. so to summarize, I want to find the lowest low since the last break of highest high. |
| snappyfrog 751 posts msg #161438 - Ignore snappyfrog |
11/26/2024 9:15:25 AM Are you looking for something like this that finds a new low today and you can view the previous high? 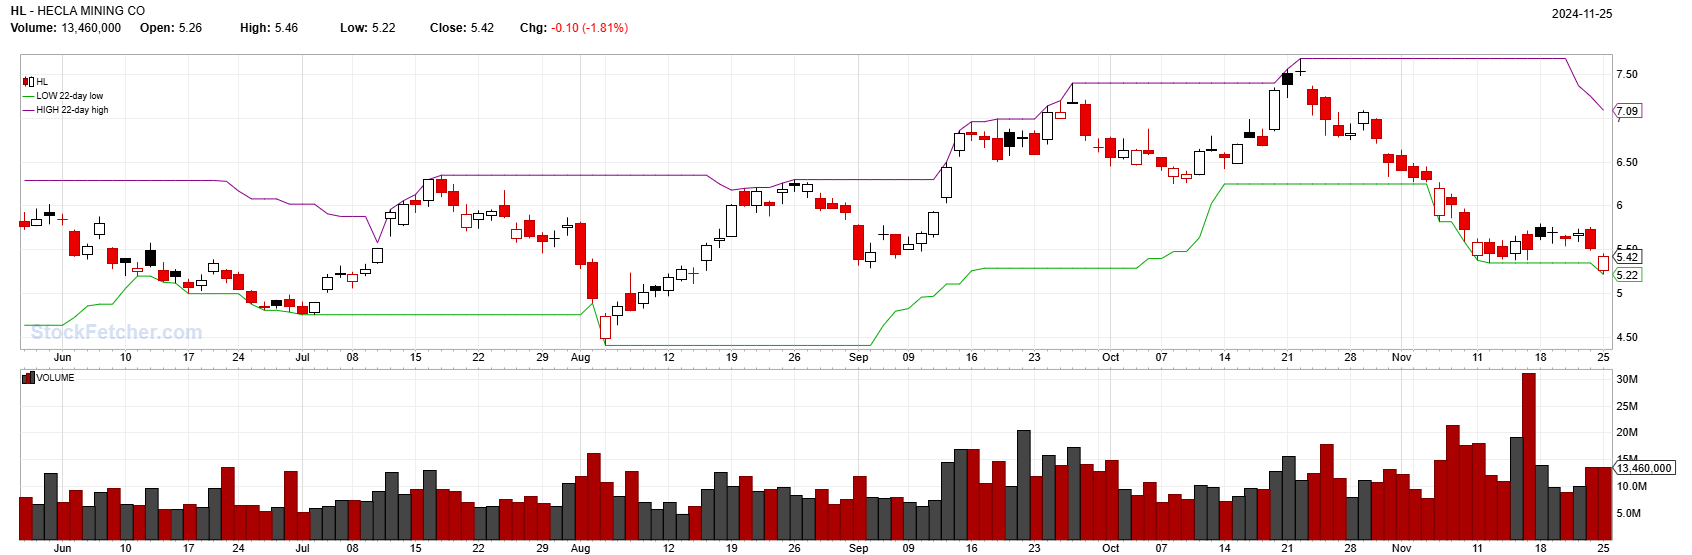 |
| rafting101 13 posts msg #161439 - Ignore rafting101 |
11/26/2024 11:10:18 AM I want to create something like the blue line here: 
This is the base. It measure the lowest low since the last break of highest high. Notice that it resets itself every break of higher high. |
| miketranz 981 posts msg #161440 - Ignore miketranz |
11/26/2024 2:52:46 PM Are you trying to create something like the Darvas box? Interesting |
| sr7 172 posts msg #161441 - Ignore sr7 |
11/26/2024 10:24:03 PM It can do fixed periods like low 10 day low But if I'm not mistaken, it doesn't have functions like lowest() or highest(). How about creating pre-define multiple periods like this: |
| rafting101 13 posts msg #161442 - Ignore rafting101 modified |
11/27/2024 7:06:13 AM Maybe it is similar to Darvas. Right now i have several lowest lines with constant values and I choose one of them. the logic that i'm looking for is clear (lowest low after highest high break) but imho it is difficult to build in a language that doesn't support looping over all the data points one by one. Just wondering if it can be solved in StockFetcher. I think that if SF had highest/lowest as functions with variables, maybe it could have been done. |
| nibor100 1,103 posts msg #161444 - Ignore nibor100 |
12/2/2024 1:46:12 PM @rafting101, I've been working on a couple of possible approaches to your issue, but I have a few questions: 1. Do you have a specific universe of stocks you are looking at for this info, such as price>$5, volume > 100K, etc.? 2. Do the bases only begin after new higher high 1 year highs? (since there are periods for some stocks to not make new highs for months) 3. What would be your ideal lookback period, 21 days, 14 days, 3 months, etc. 4. Do you need to see lines drawn or is column data sufficient. Thanks, Ed S. |
| rafting101 13 posts msg #161448 - Ignore rafting101 |
12/3/2024 3:41:06 AM @nibor100 regarding questions 1,2,3, i dont have specific filters. you can use your own preference. I am interested in a way to calculate this value. 4. lines or column... both are a good start. i think its not a problem to draw or add a column, once the value can be calculated. the challenge is to calculate it. do you have any idea how to do it? |
| rafting101 13 posts msg #161449 - Ignore rafting101 modified |
12/3/2024 3:41:06 AM (removed duplicated message) |
| StockFetcher Forums · General Discussion · Dyanmic lowest/highest for X days (variable). | << 1 2 >>Post Follow-up |